Apache Traffic Control - Migrating Grafana scripted CDN metrics dashboards to Scenes: a seamless transition
The landscape of data visualization is continuously evolving, and staying current with the latest tools and best practices is crucial. Grafana, a widely-used open-source analytics and monitoring platform, consistently leads with innovative features and enhancements. A significant development is the launch of Grafana Scenes, a potent new tool for creating dynamic dashboard experiences.
What is Grafana Scenes?
Grafana Scenes is a new frontend library that enables developers to create dashboard-like experiences — such as querying and transformations, dynamic panel rendering, and time ranges — directly within their Grafana application plugins.
Grafana Scenes was first introduced with the launch of Grafana 10 at GrafanaCON 2023.
Why Migrate to Grafana Scenes?
Context
Apache Traffic Control (ATC), an open-source CDN implementation, currently utilizes deprecated scripted dashboards written in pure JavaScript to visualize CDN metrics (bandwidth, connections, TPS, …) and server metrics (CPU, memory, …). (Reference: https://github.com/grafana/grafana/issues/24059)
Migrating existing scripted dashboards to Grafana Scenes offers several advantages, including:
Future-Proof Compatibility: By adopting Scenes, ATC ensures compatibility with upcoming Grafana updates. Maintaining compatibility with newer versions becomes effortless as Grafana evolves.
Enhanced Performance: Scenes are architected for superior efficiency and lower weight compared to scripted dashboards. This translates to faster loading times and a smoother user experience, especially for complex dashboards.
Greater Flexibility: Scenes grant developers access to a wider array of customization options and features. From interactive components to advanced layout controls, Scenes empower the ATC community to create richer and more engaging dashboards.
Thriving Community Support: As Scenes gain momentum within the Grafana community, ATC contributors can leverage a growing pool of resources, tutorials, and plugins dedicated to enhancing Scenes functionality. Migrating to Scenes ensures access to this expanding ecosystem for collaboration and support.
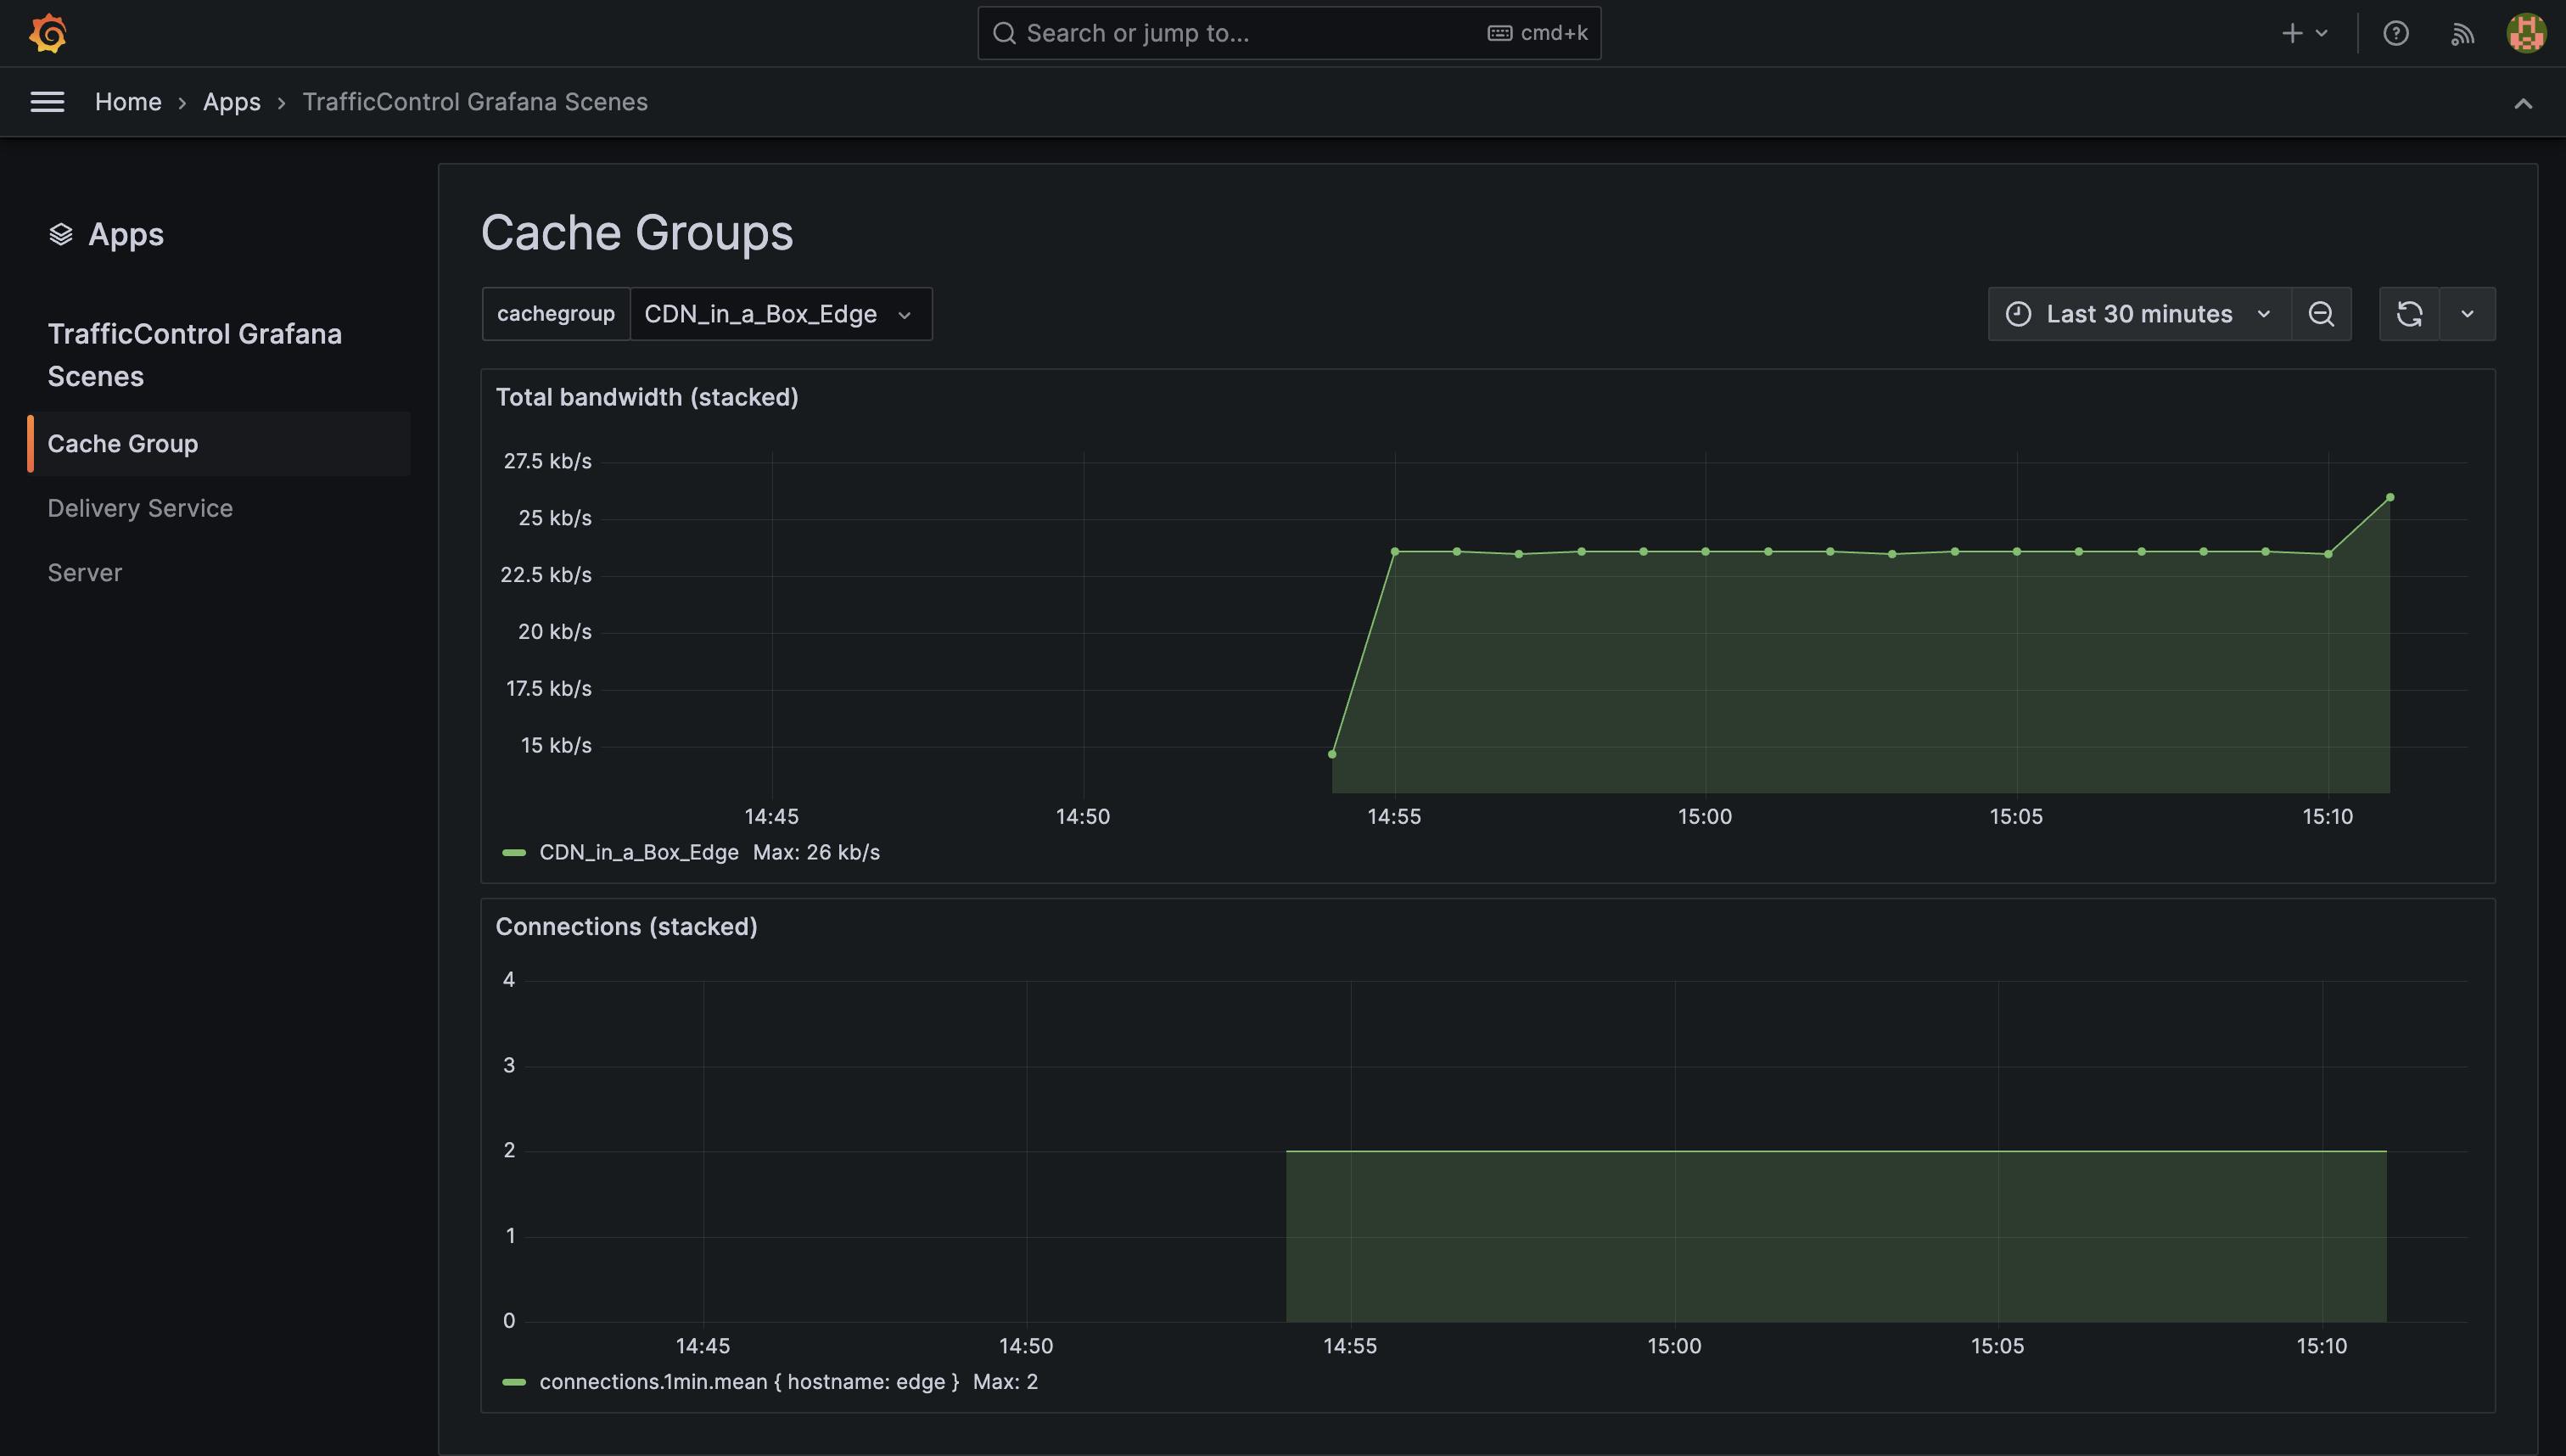
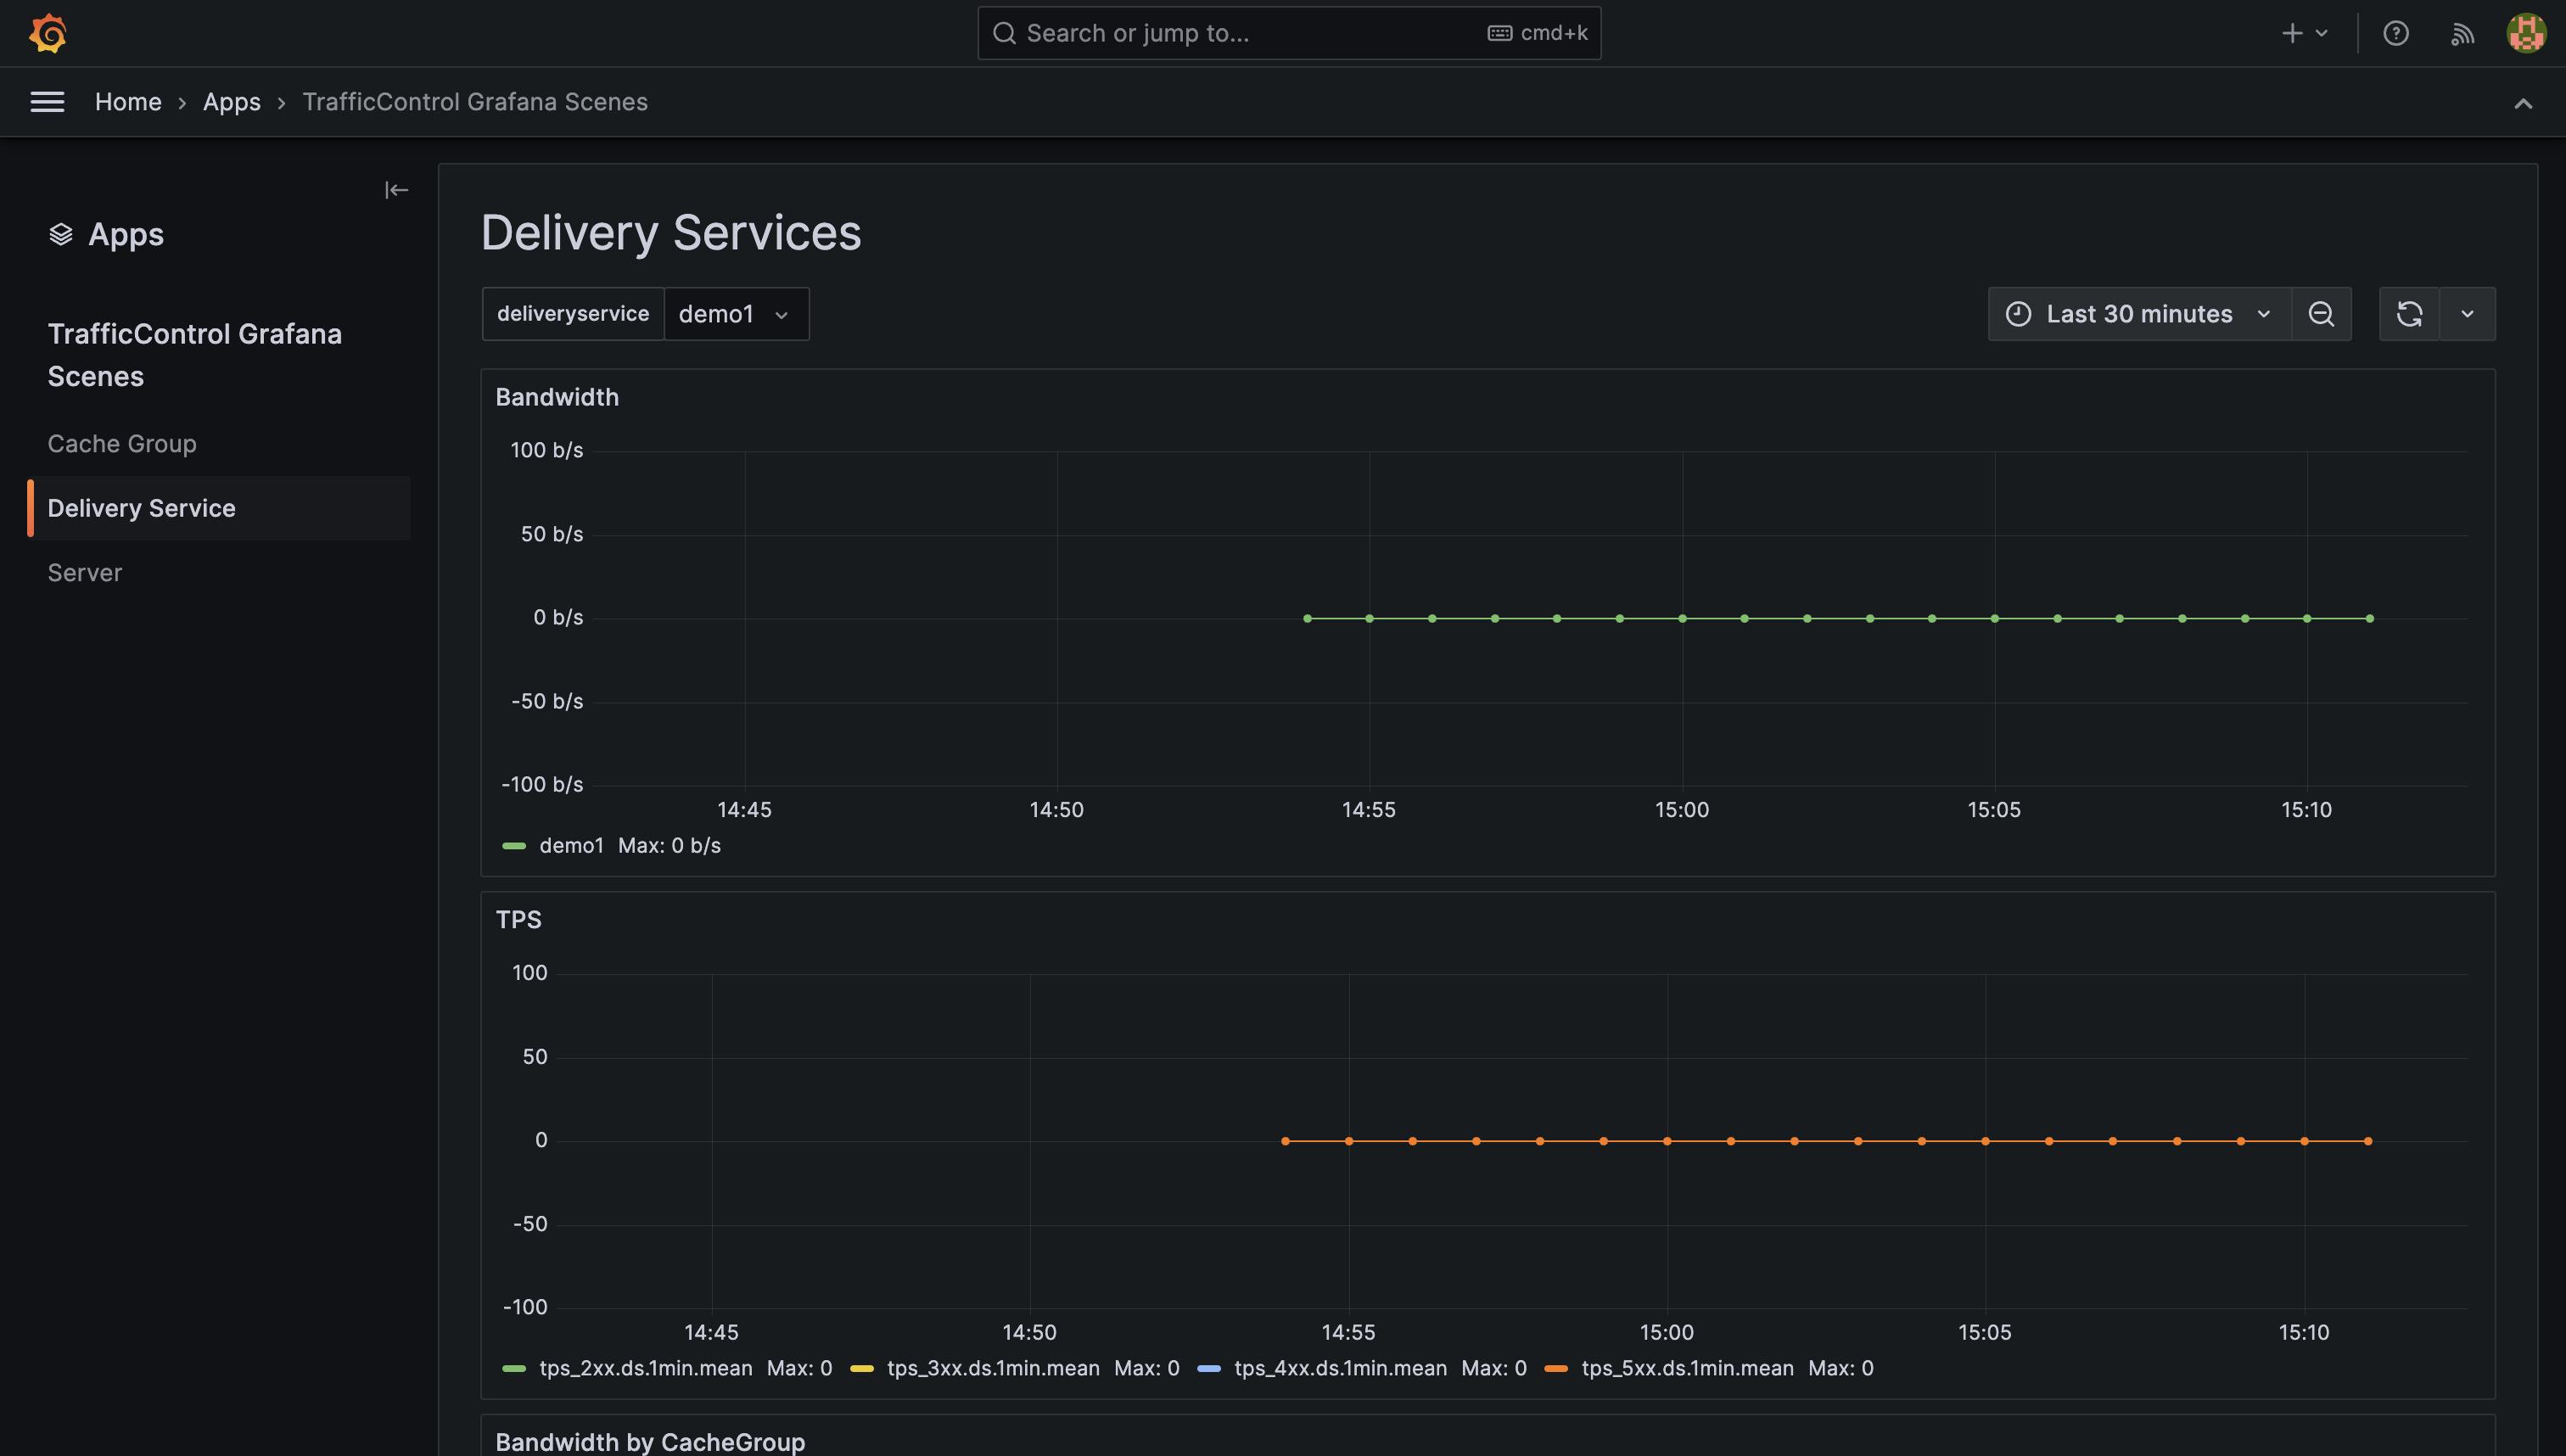
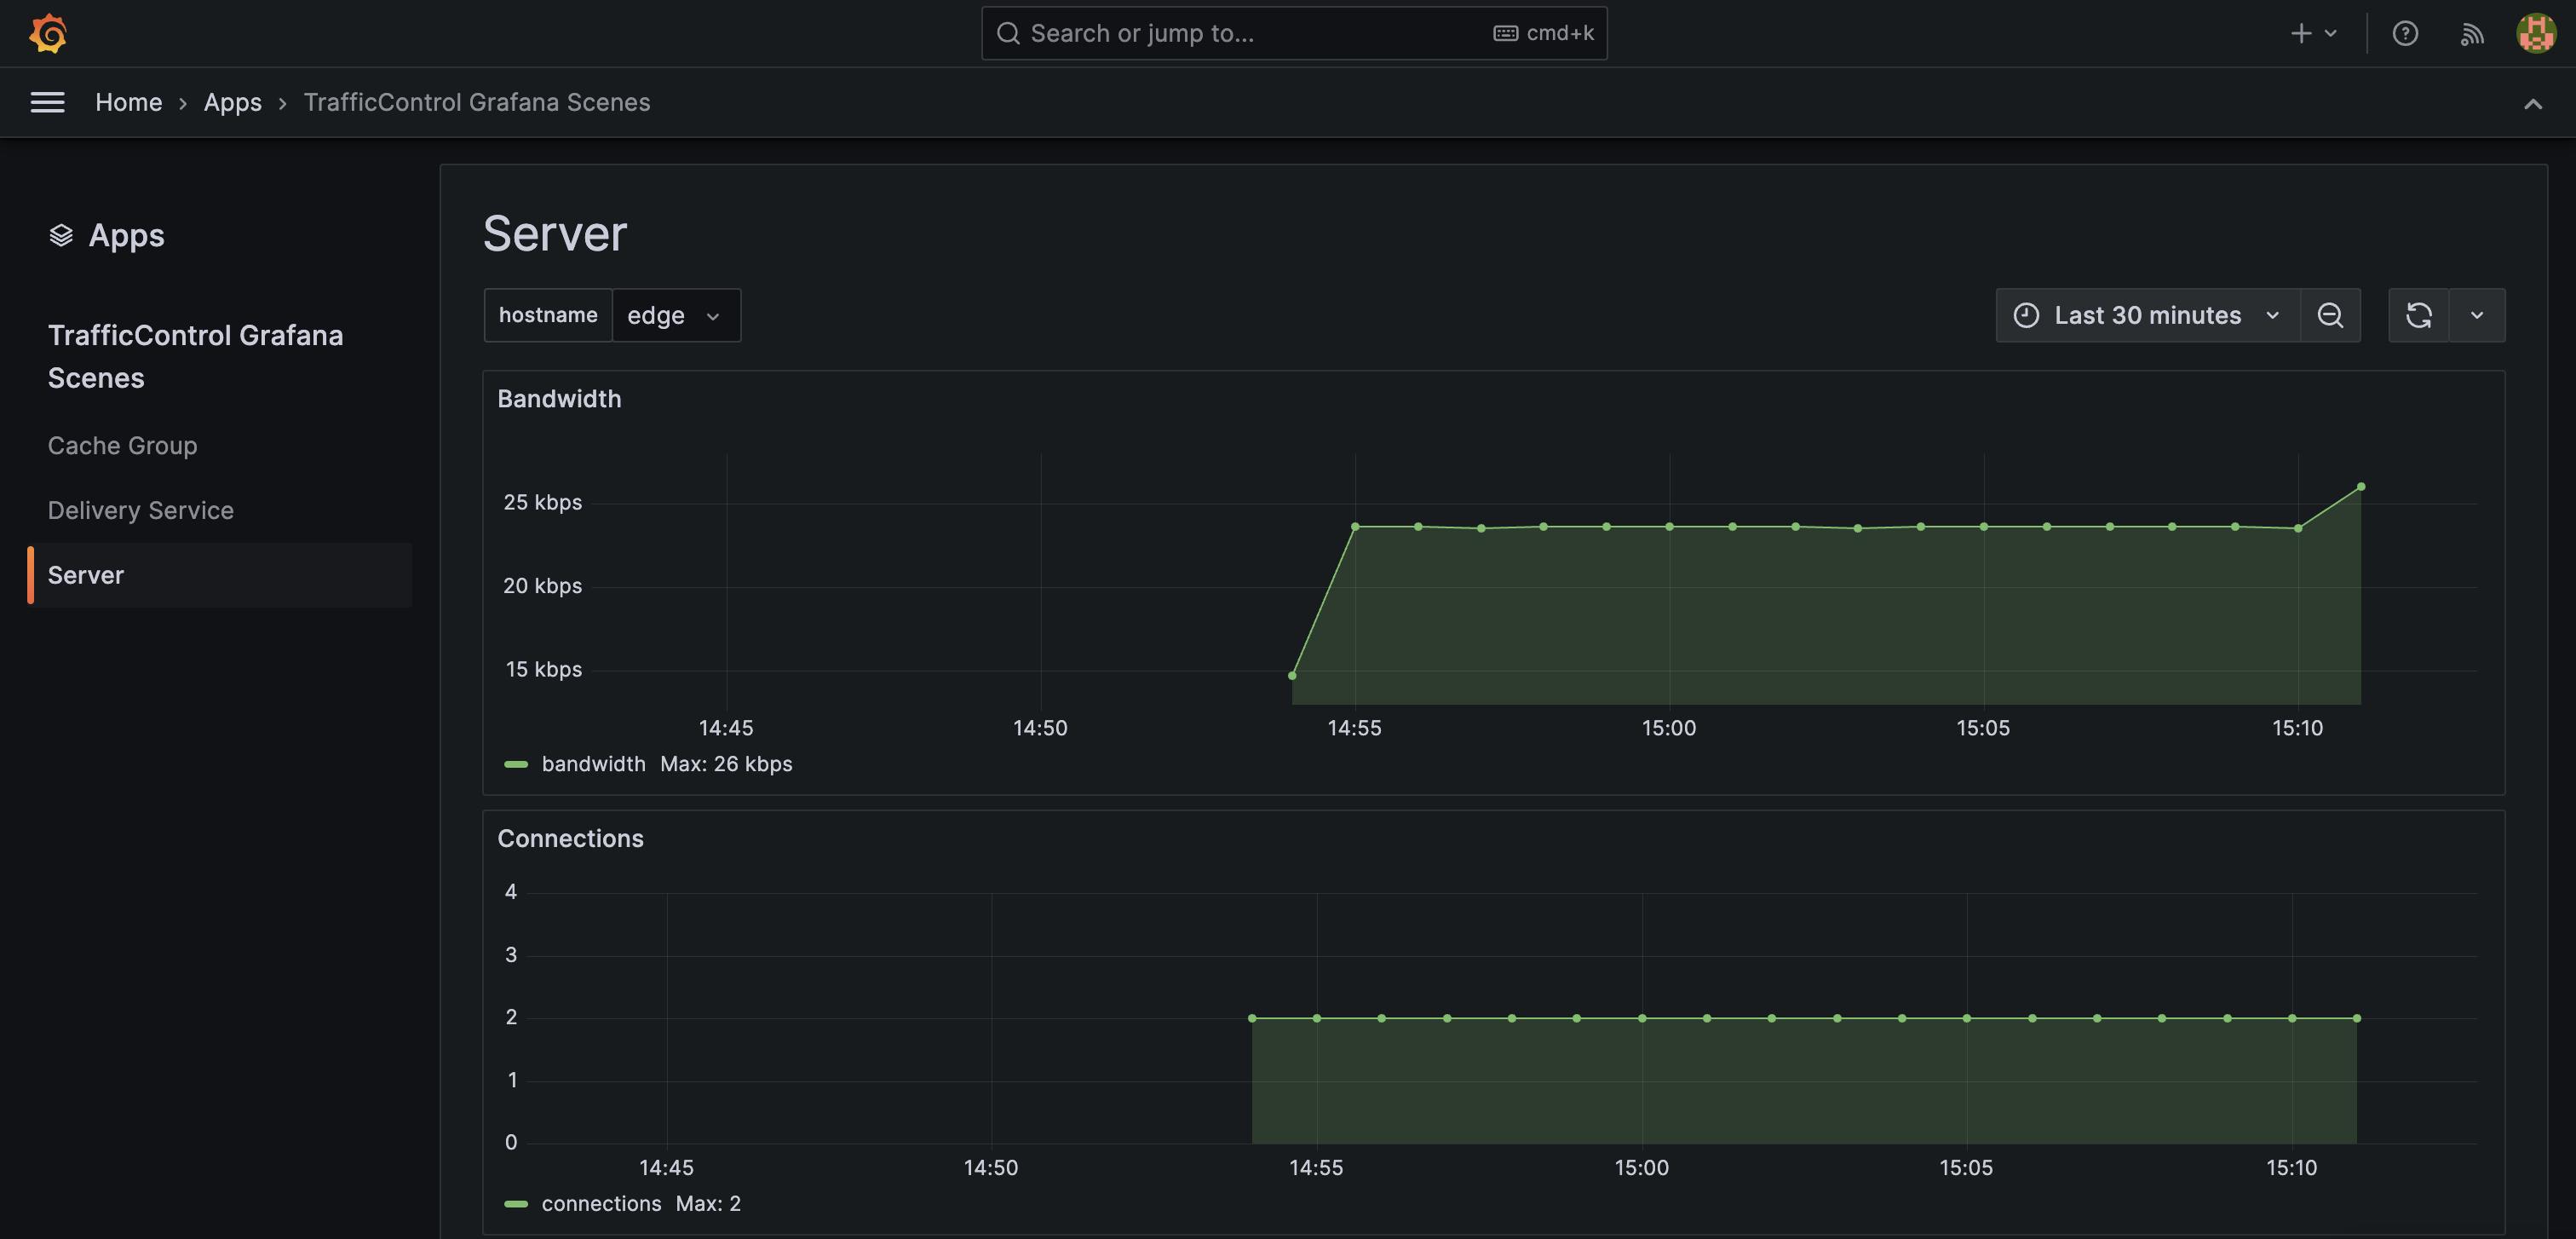
Exploring the UI of Grafana Scenes:
The Codebase
The Grafana Scenes code for ATC is available on GitHub: https://github.com/apache/trafficcontrol/tree/master/traffic_stats/trafficcontrol-scenes
Pull Request for Reference
The pull request details the migration process: https://github.com/apache/trafficcontrol/pull/7927
Code Snippets
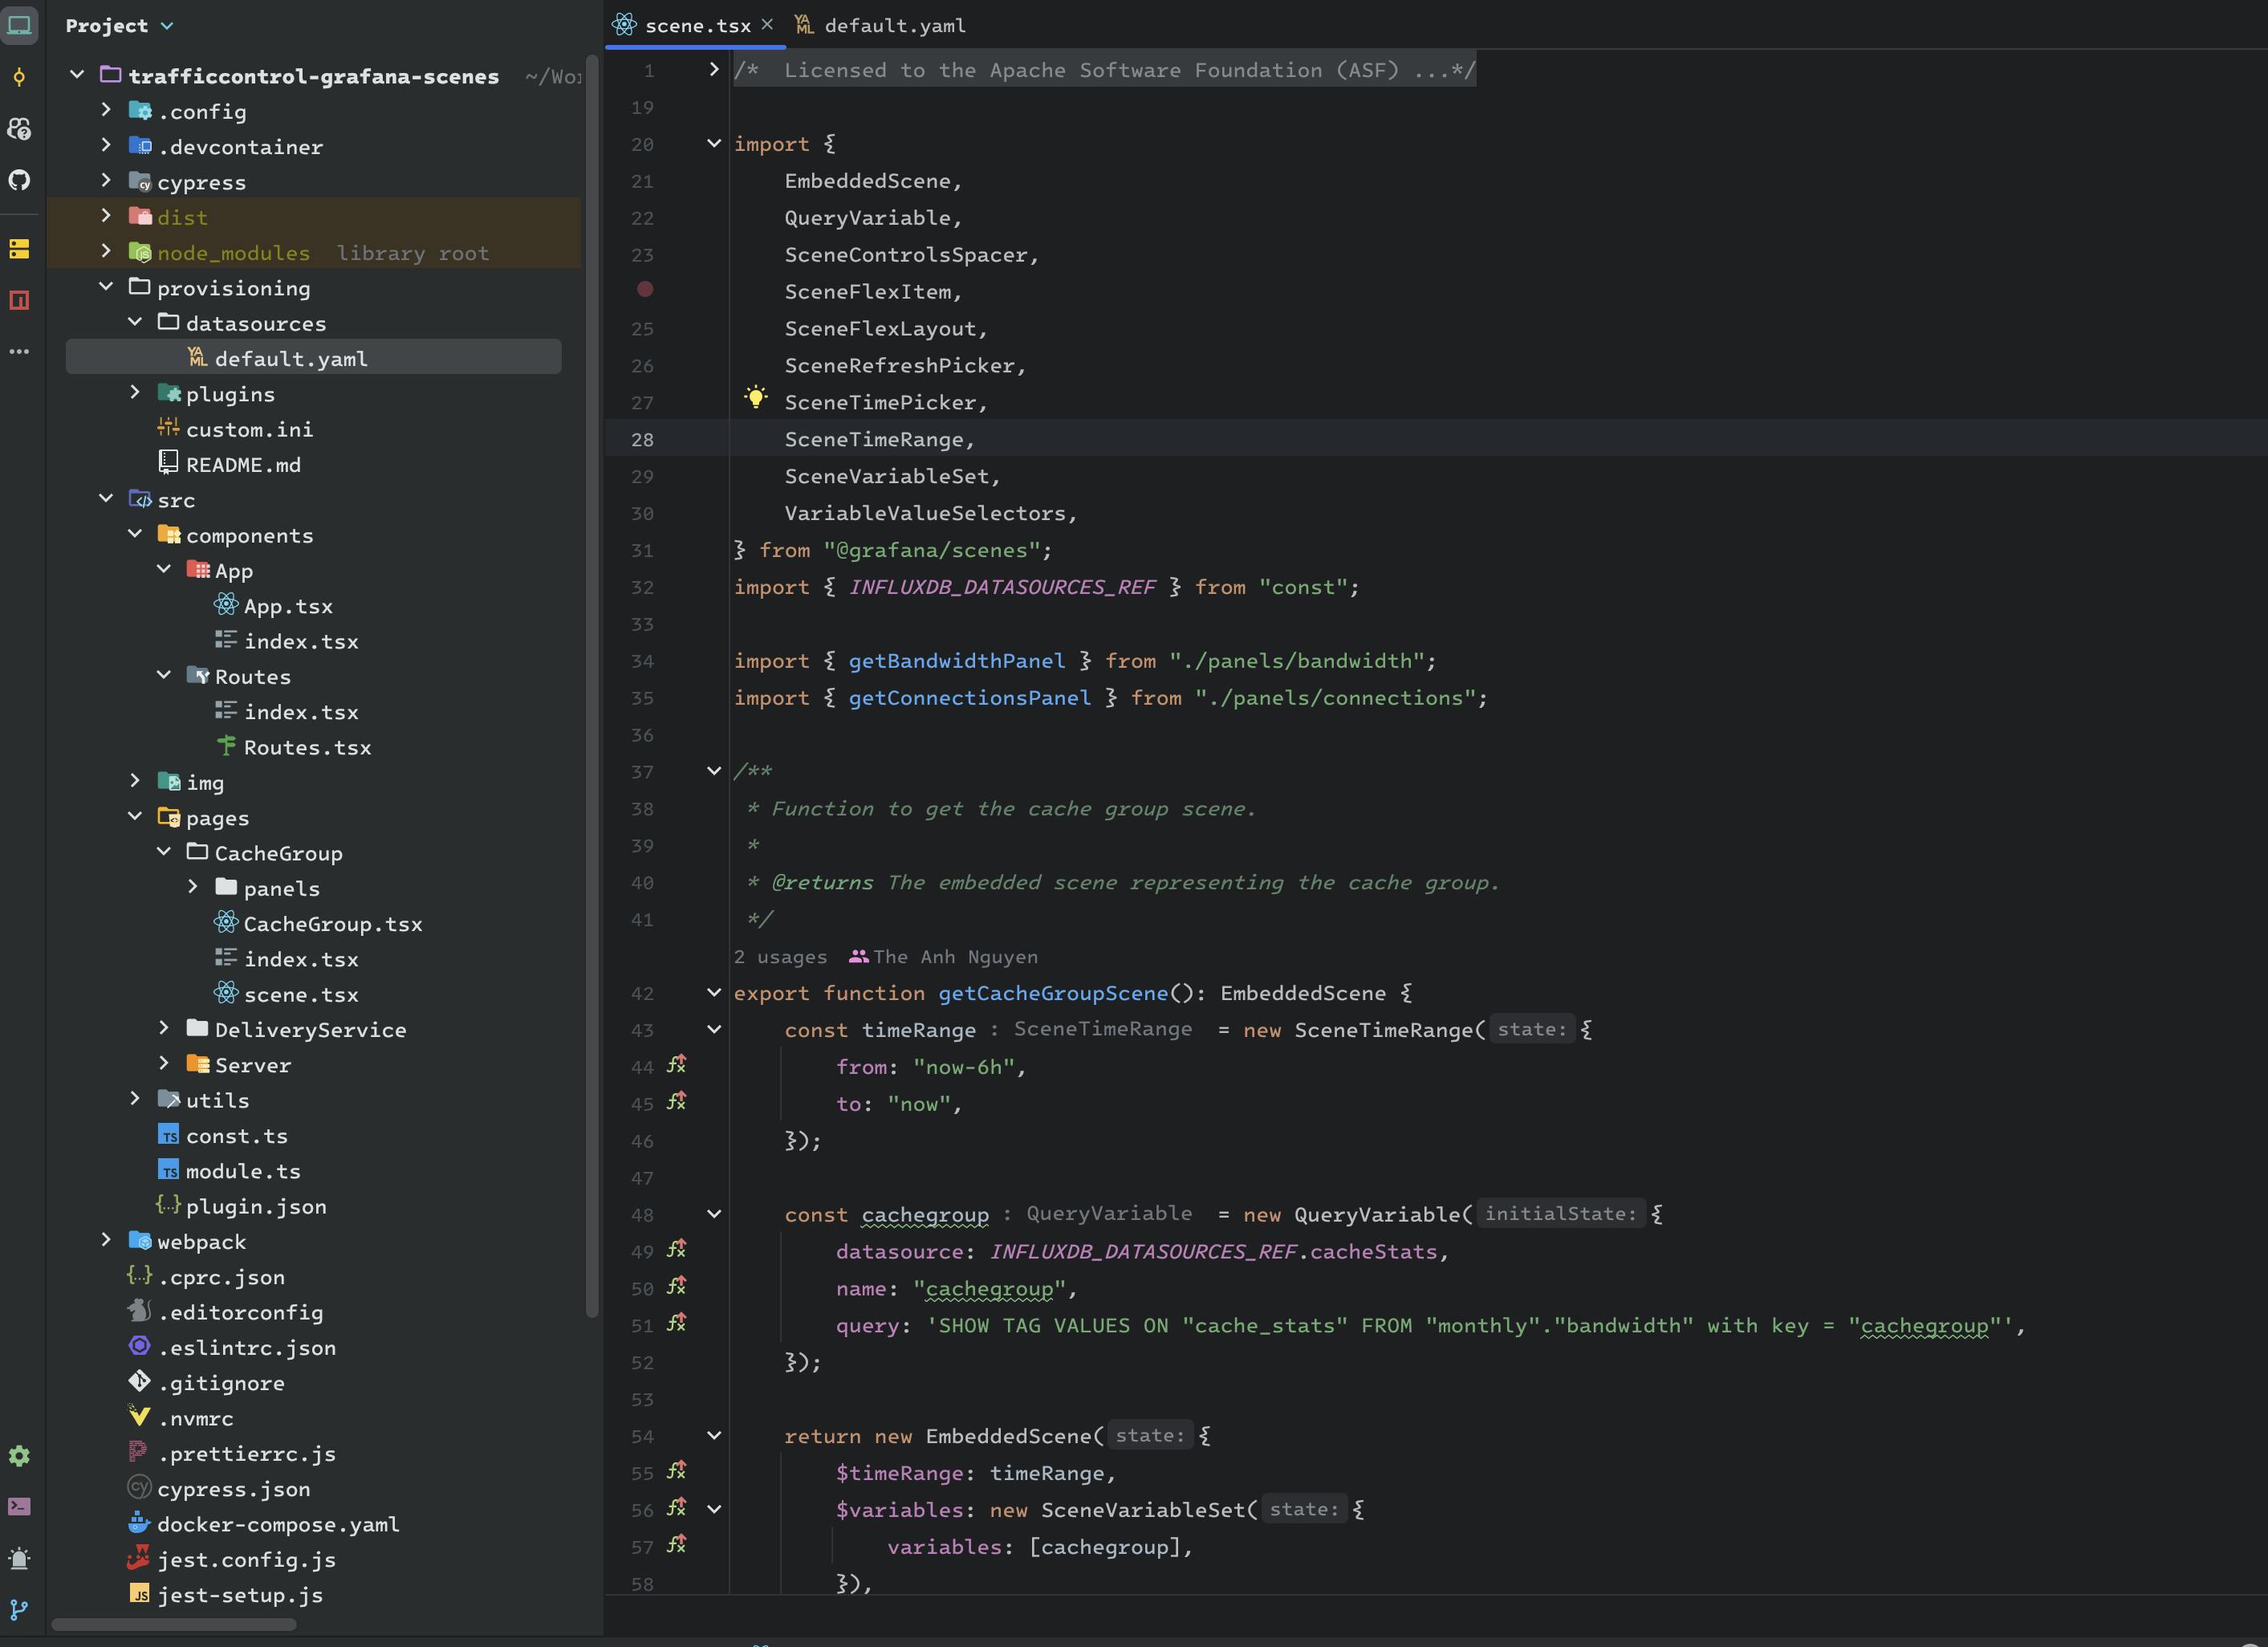
Here is the code structure of TrafficControl Grafana Scenes and some basic code snippets to showcase Grafana Scenes implementation:
import {
    EmbeddedScene,
    QueryVariable,
    SceneControlsSpacer,
    SceneFlexItem,
    SceneFlexLayout,
    SceneRefreshPicker,
    SceneTimePicker,
    SceneTimeRange,
    SceneVariableSet,
    VariableValueSelectors,
} from "@grafana/scenes";
import { INFLUXDB_DATASOURCES_REF } from "const";

import { getBandwidthPanel } from "./panels/bandwidth";
import { getConnectionsPanel } from "./panels/connections";

/**
 * Function to get the cache group scene.
 *
 * @returns The embedded scene representing the cache group.
 */
export function getCacheGroupScene(): EmbeddedScene {
    const timeRange = new SceneTimeRange({
        from: "now-6h",
        to: "now",
    });

    const cachegroup = new QueryVariable({
        datasource: INFLUXDB_DATASOURCES_REF.cacheStats,
        name: "cachegroup",
        query: 'SHOW TAG VALUES ON "cache_stats" FROM "monthly"."bandwidth" with key = "cachegroup"',
    });

    return new EmbeddedScene({
        $timeRange: timeRange,
        $variables: new SceneVariableSet({
            variables: [cachegroup],
        }),
        body: new SceneFlexLayout({
            children: [
                new SceneFlexItem({
                    body: getBandwidthPanel(),
                    minHeight: 300,
                }),
                new SceneFlexItem({
                    body: getConnectionsPanel(),
                    minHeight: 300,
                }),
            ],
            direction: "column",
        }),
        controls: [
            new VariableValueSelectors({}),
            new SceneControlsSpacer(),
            new SceneTimePicker({isOnCanvas: true}),
            new SceneRefreshPicker({
                intervals: ["5s", "1m", "1h"],
                isOnCanvas: true,
            }),
        ],
    });
}
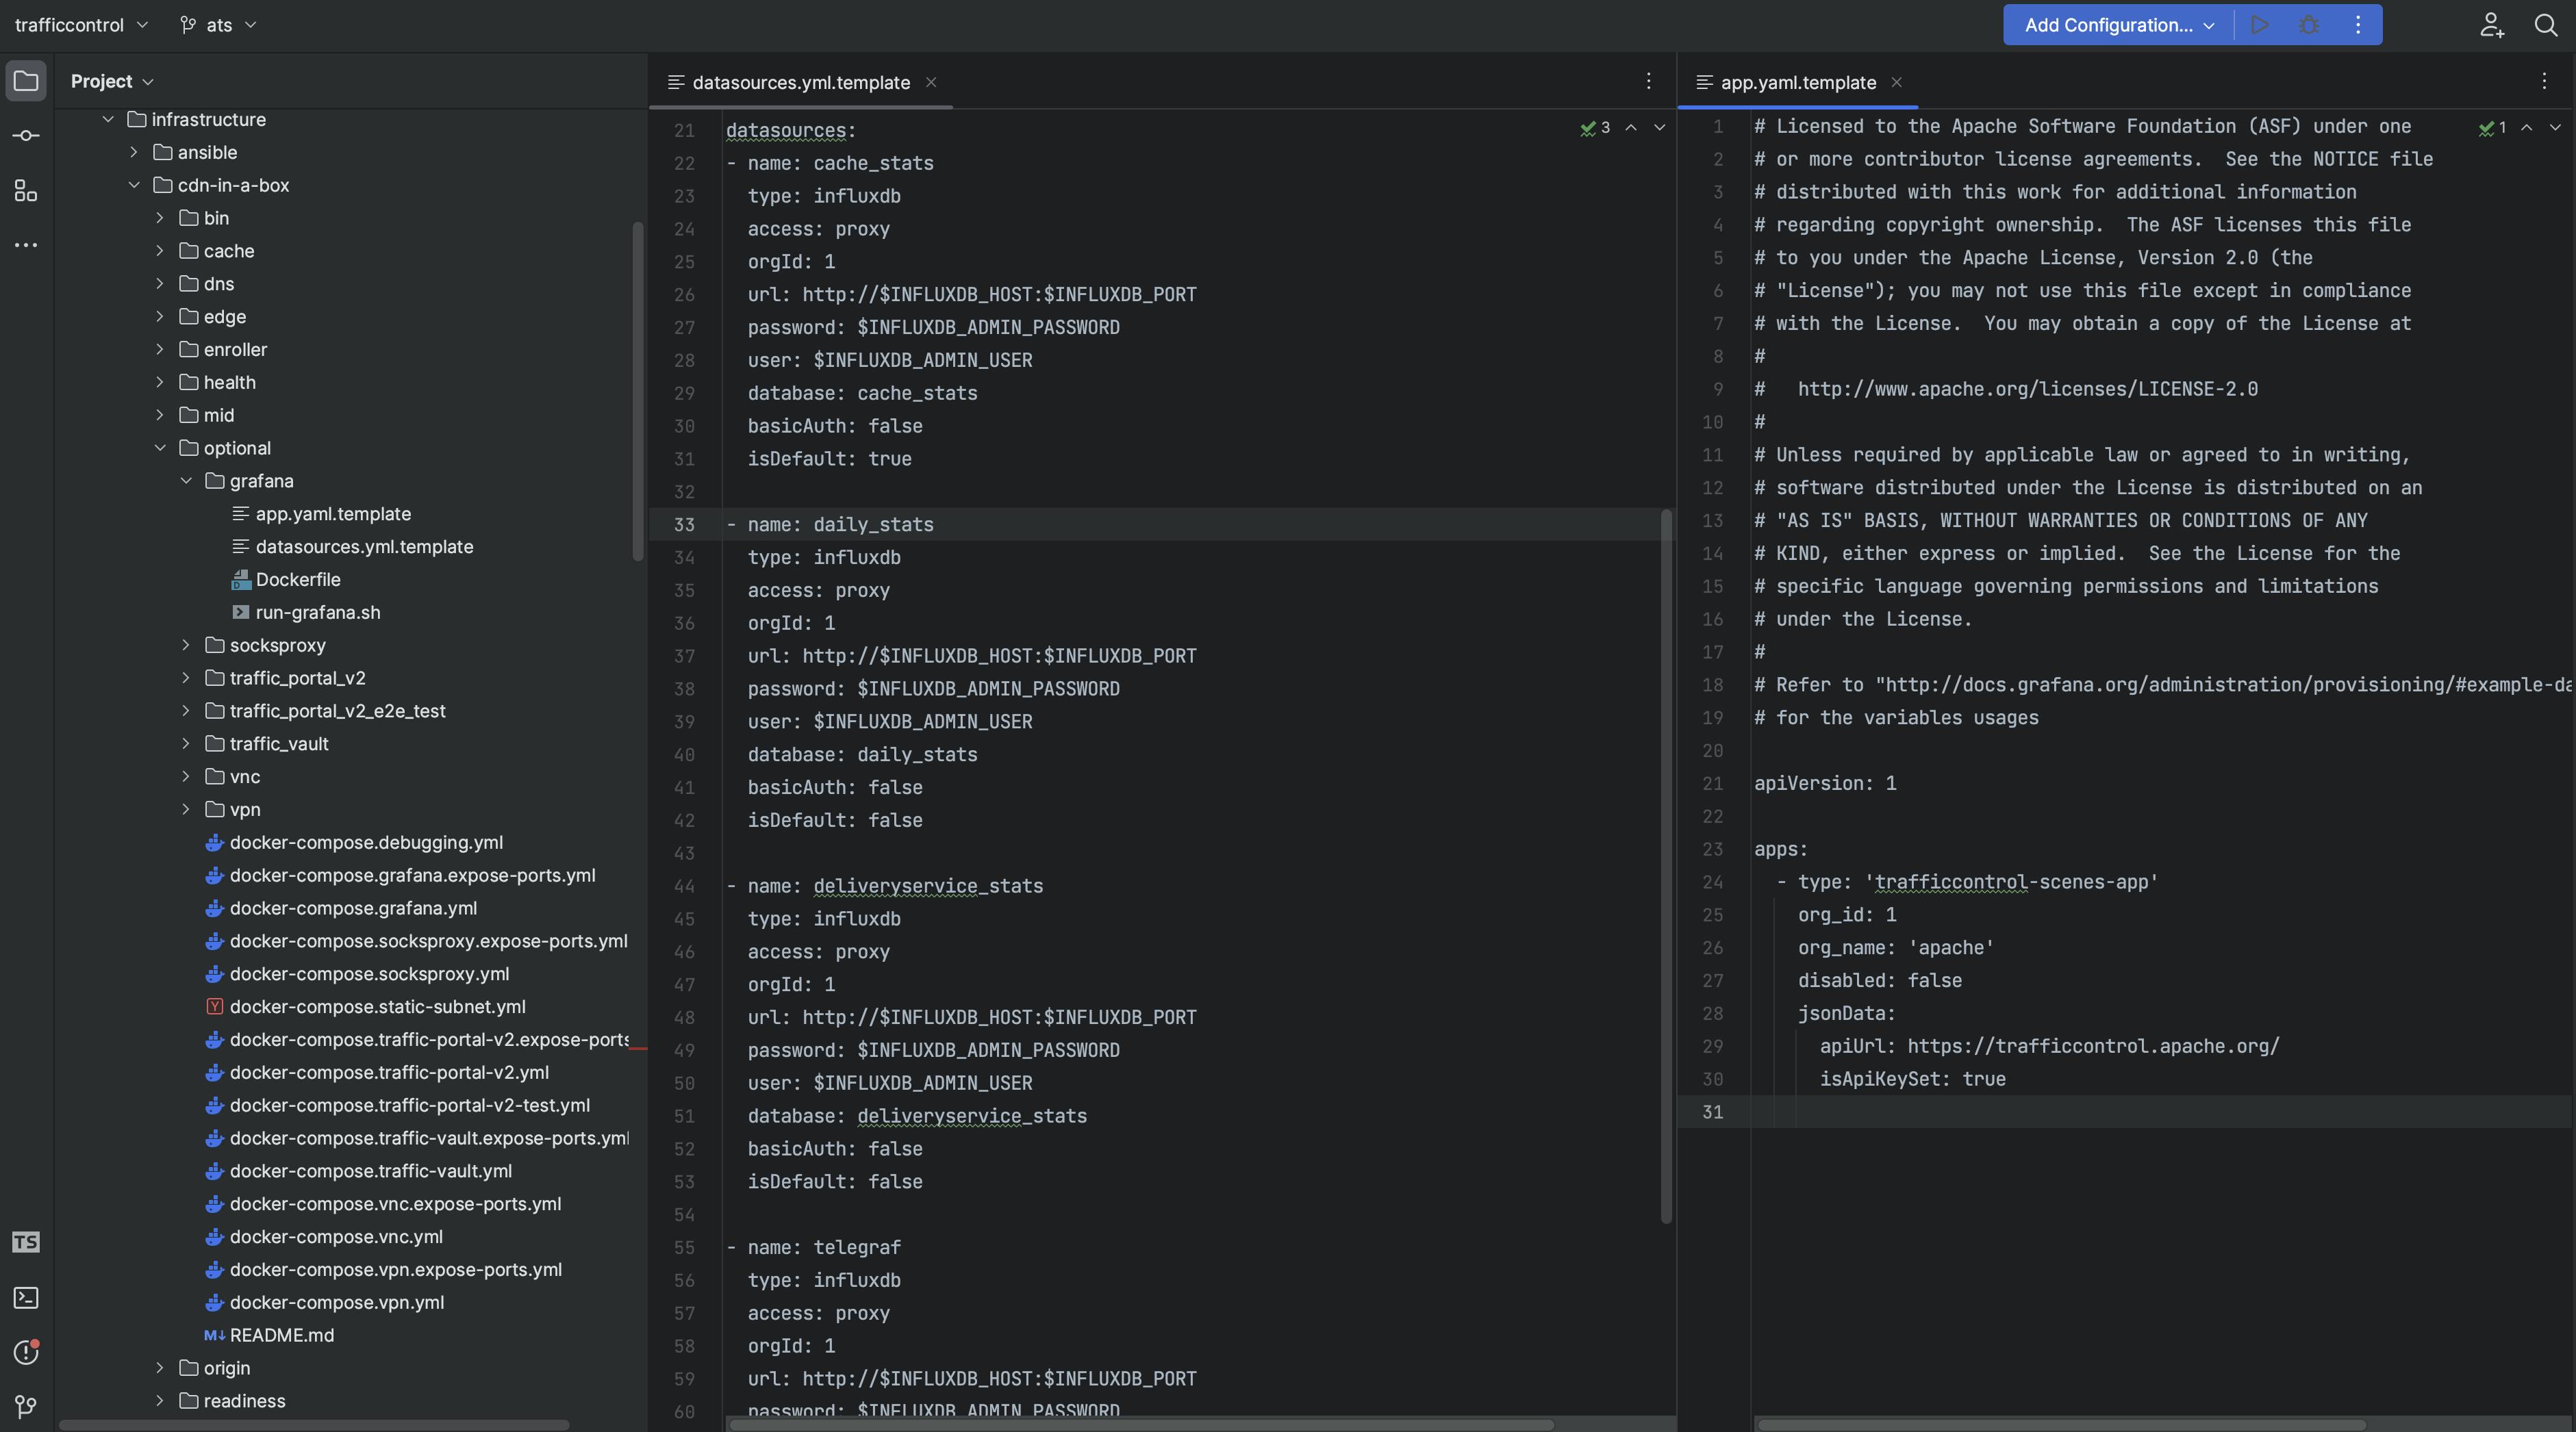
To make Grafana work, you need to add some data sources and information about the traffic control scenes app during provisioning.
Conclusion
Migrating ATC's CDN metric dashboards to Grafana Scenes empowers developers with a modern, performant, and future-proof visualization solution. This shift unlocks access to a thriving community and a vast array of features to craft exceptional dashboards. By leveraging Scenes, ATC can streamline development and deliver an enhanced user experience for CDN metric visualization.
Explore Grafana Scenes documentation: https://grafana.com/blog/2023/08/03/new-in-grafana-10-grafana-scenes-for-building-dynamic-dashboarding-experiences/
Contribute to the ATC project: https://github.com/apache/trafficcontrol
